
The Backtesting Blind Spot: Why Published Win Rates Almost Never Survive Live Trading
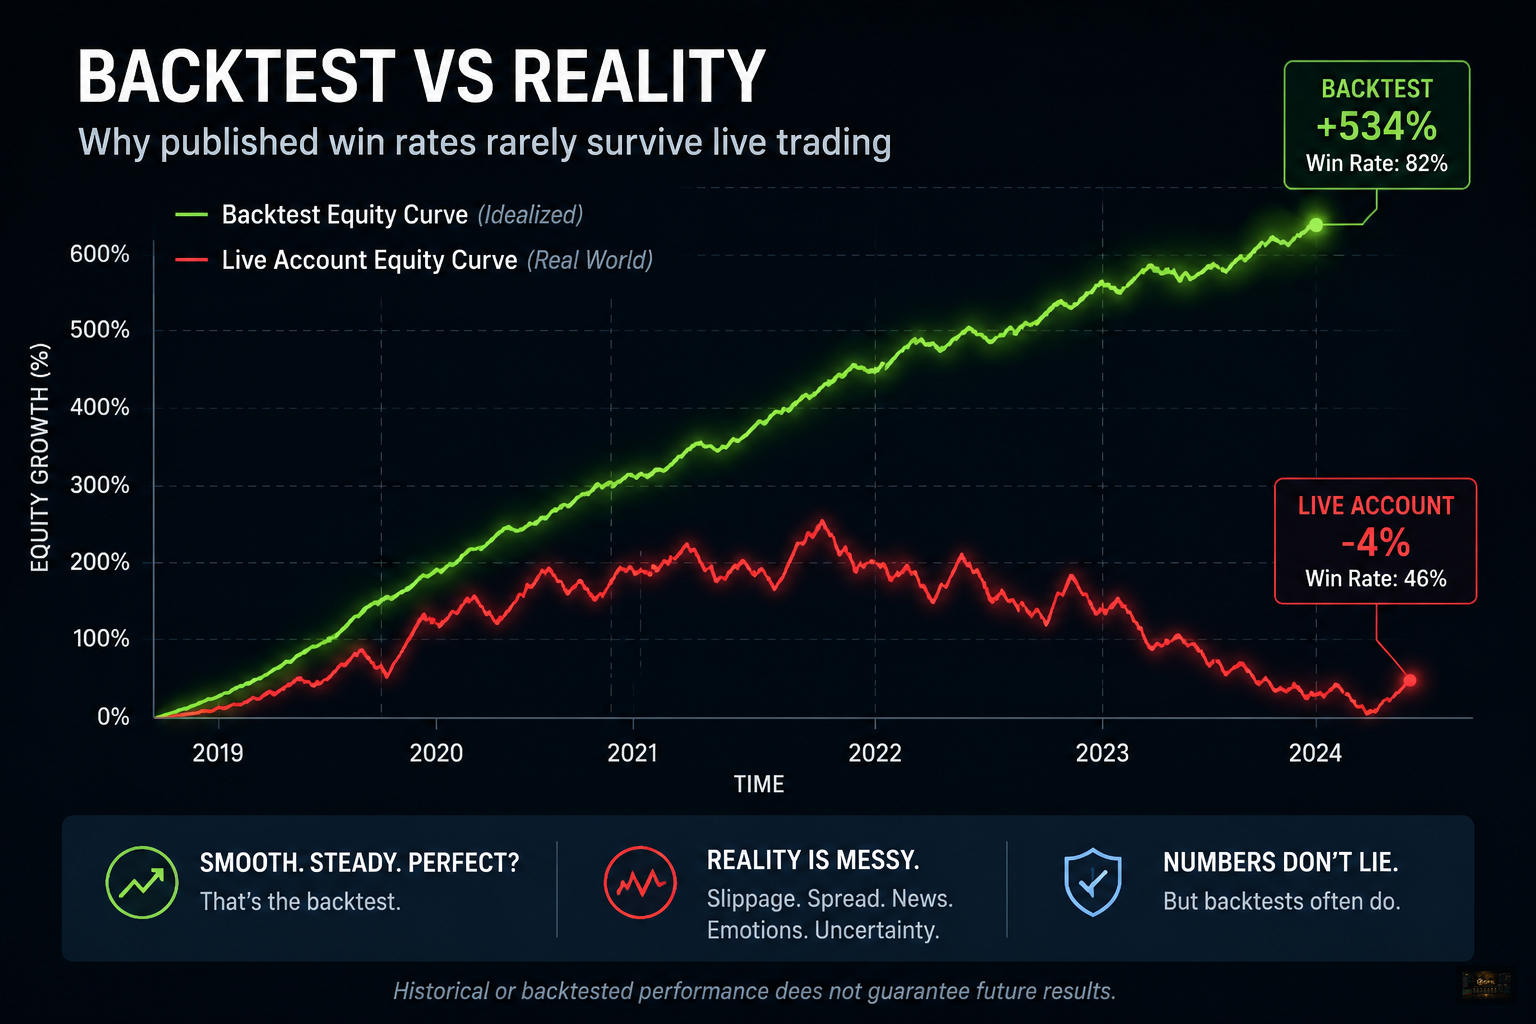
Every week, somewhere on Telegram, YouTube, or a signal vendor's landing page, a chart appears: a smooth equity curve climbing up and to the right, a win rate north of 80%, a caption that says "backtested over 5 years." Retail traders have learned to be skeptical of the marketing tone, but far fewer are skeptical of the methodology behind the number itself. That's the actual blind spot — not that vendors lie about their win rate, but that the win rate was calculated in a way that was never going to hold up outside the spreadsheet that produced it.
This isn't a niche technical quibble. It's the single biggest reason retail strategies that look statistically sound on paper fail in live accounts. Below are the five places where that gap opens up, in the order they usually do the most damage.
1. Look-ahead bias hiding inside the indicator, not the strategy
Most traders check their entry/exit logic for look-ahead bias — "am I using tomorrow's close to decide today's trade?" — but far fewer check the indicators feeding that logic. Two common leaks:
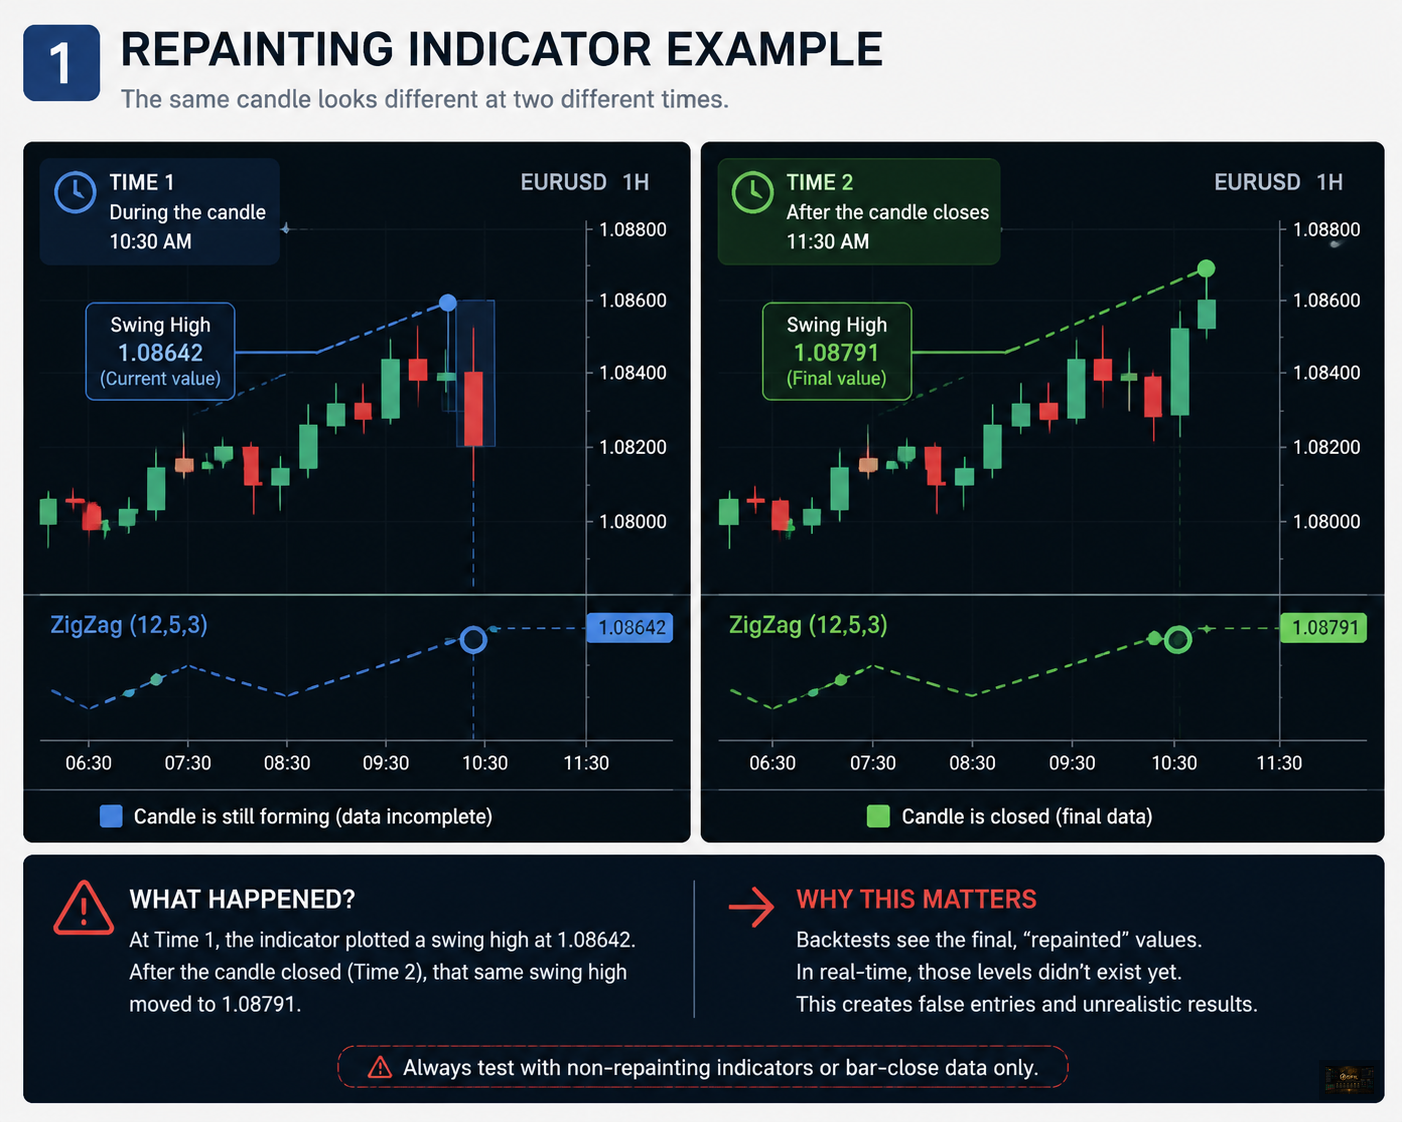
- Repainting indicators. Many popular custom indicators (certain ZigZag variants, some "smart money concept" order block tools, adaptive moving averages) recalculate historical values as new bars close. A backtest run today sees the final, repainted version of every historical bar — a version that never existed in real time. The strategy looks like it caught every swing high and low perfectly because, retroactively, it did.
- Same-candle execution. A backtest that triggers an entry the instant a signal condition is met on the current, unclosed candle — rather than waiting for that candle to close and executing on the next one — is trading with information that wasn't actually available yet. On a 1-hour chart this can inflate a strategy's apparent edge by a meaningful margin, because the backtest is quietly allowed to "see" where the candle ends before deciding whether to enter.
Neither of these shows up by eyeballing an equity curve. You have to check whether the indicator's historical values are static across multiple runs, and whether the backtest engine executes on bar-close or bar-open.
2. Survivorship bias in what gets published at all
If a vendor runs the same base strategy across 40 parameter variations, publishes the best 2, and quietly retires the other 38, every number in the marketing material is true and every number is meaningless. This is survivorship bias applied to strategy selection rather than asset selection, and it's endemic in the signal-selling and EA-selling space because there's no equivalent of a fund's audited track record — nothing stops a vendor from only showing you the survivor.
The tell isn't in the backtest itself; it's in what's absent. A single flawless equity curve with no mention of the parameter search that produced it, no out-of-sample period, and no discussion of the variations that were discarded, should be read as "this is the best of an unknown number of attempts," not "this is what the strategy does."
3. Spread and slippage modeled as a static best-case number
This is the one most directly relevant to a tools-and-calculators audience, because it's a modeling error, not a judgment error — meaning it's fixable if you know to check for it.
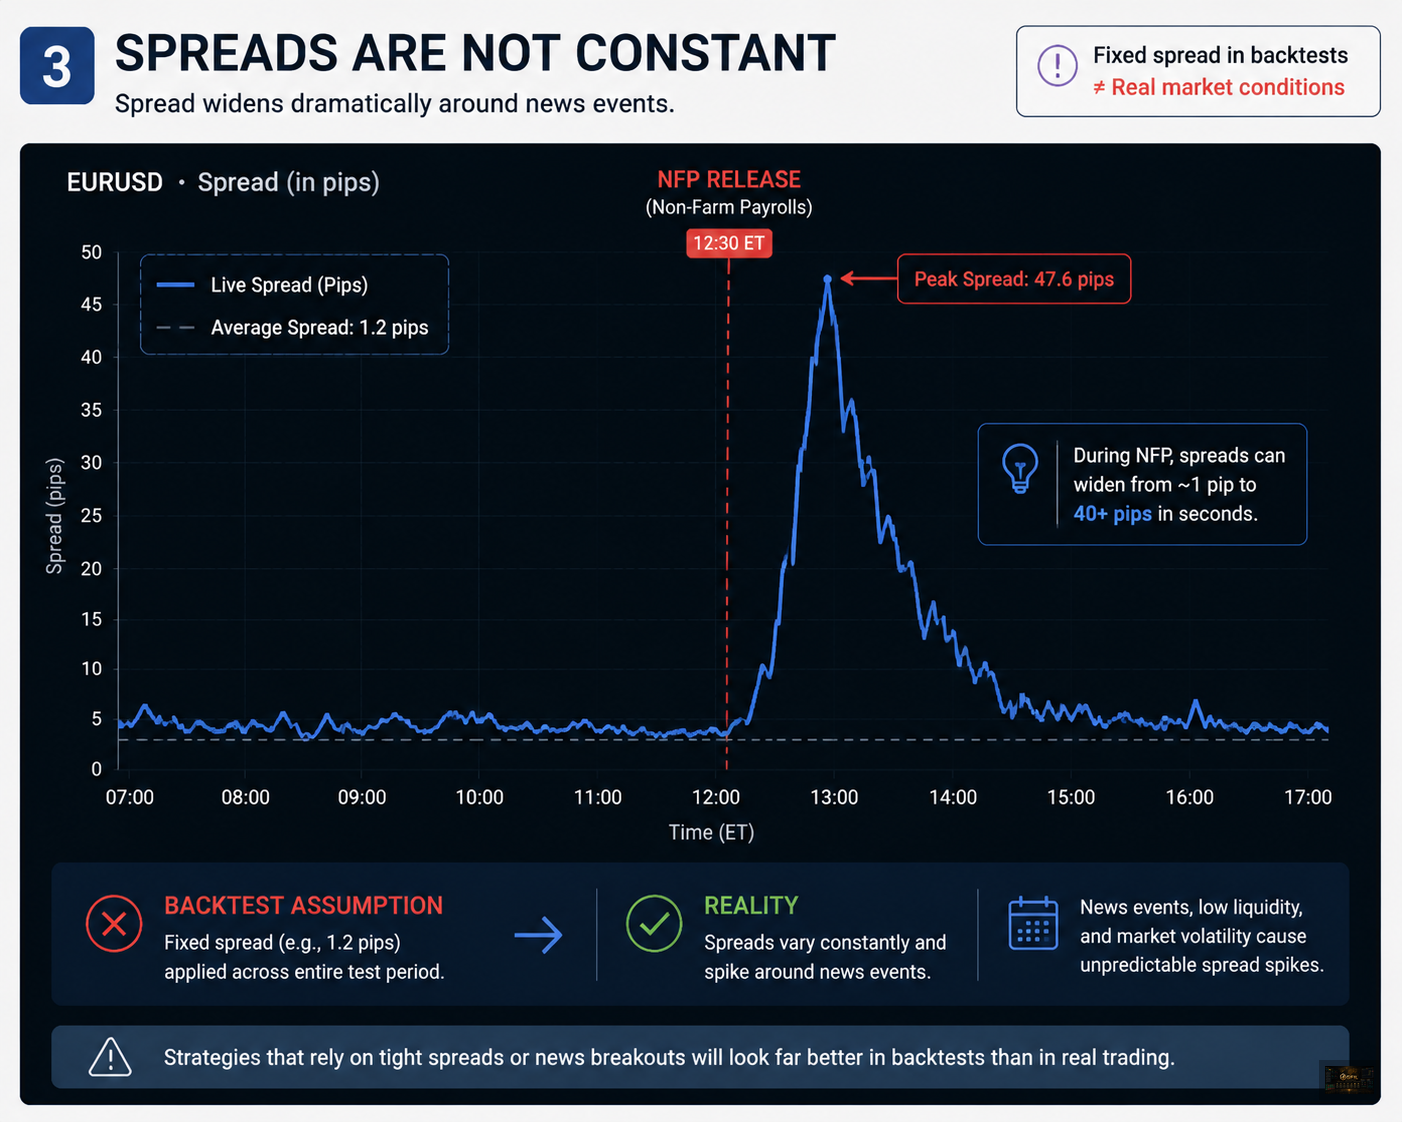
A large share of retail backtesting platforms let a strategy run on a fixed spread (say, 1.2 pips on EURUSD) applied uniformly across the entire test period. Real spreads are not fixed. They widen during the London/New York overlap, they widen sharply around NFP and CPI releases, and on metals like XAUUSD they can move from single digits to 40+ points in the seconds after a surprise print. A strategy whose edge depends on catching volatility around news events — which describes a large fraction of retail breakout systems — will show a backtested win rate that assumes it always got filled at the calm, average spread. In live trading it gets filled at the worst spread, precisely because that's when it's trying to trade.
The same applies to slippage on stop-loss and take-profit orders during fast markets, and to swap/rollover costs on positions held past end-of-day, both of which are frequently left at zero in default backtest settings and never re-enabled.
4. Curve-fitting disguised as "optimization"
There is a meaningful, honest version of parameter optimization, and a dishonest version, and from the outside they produce identical-looking charts.
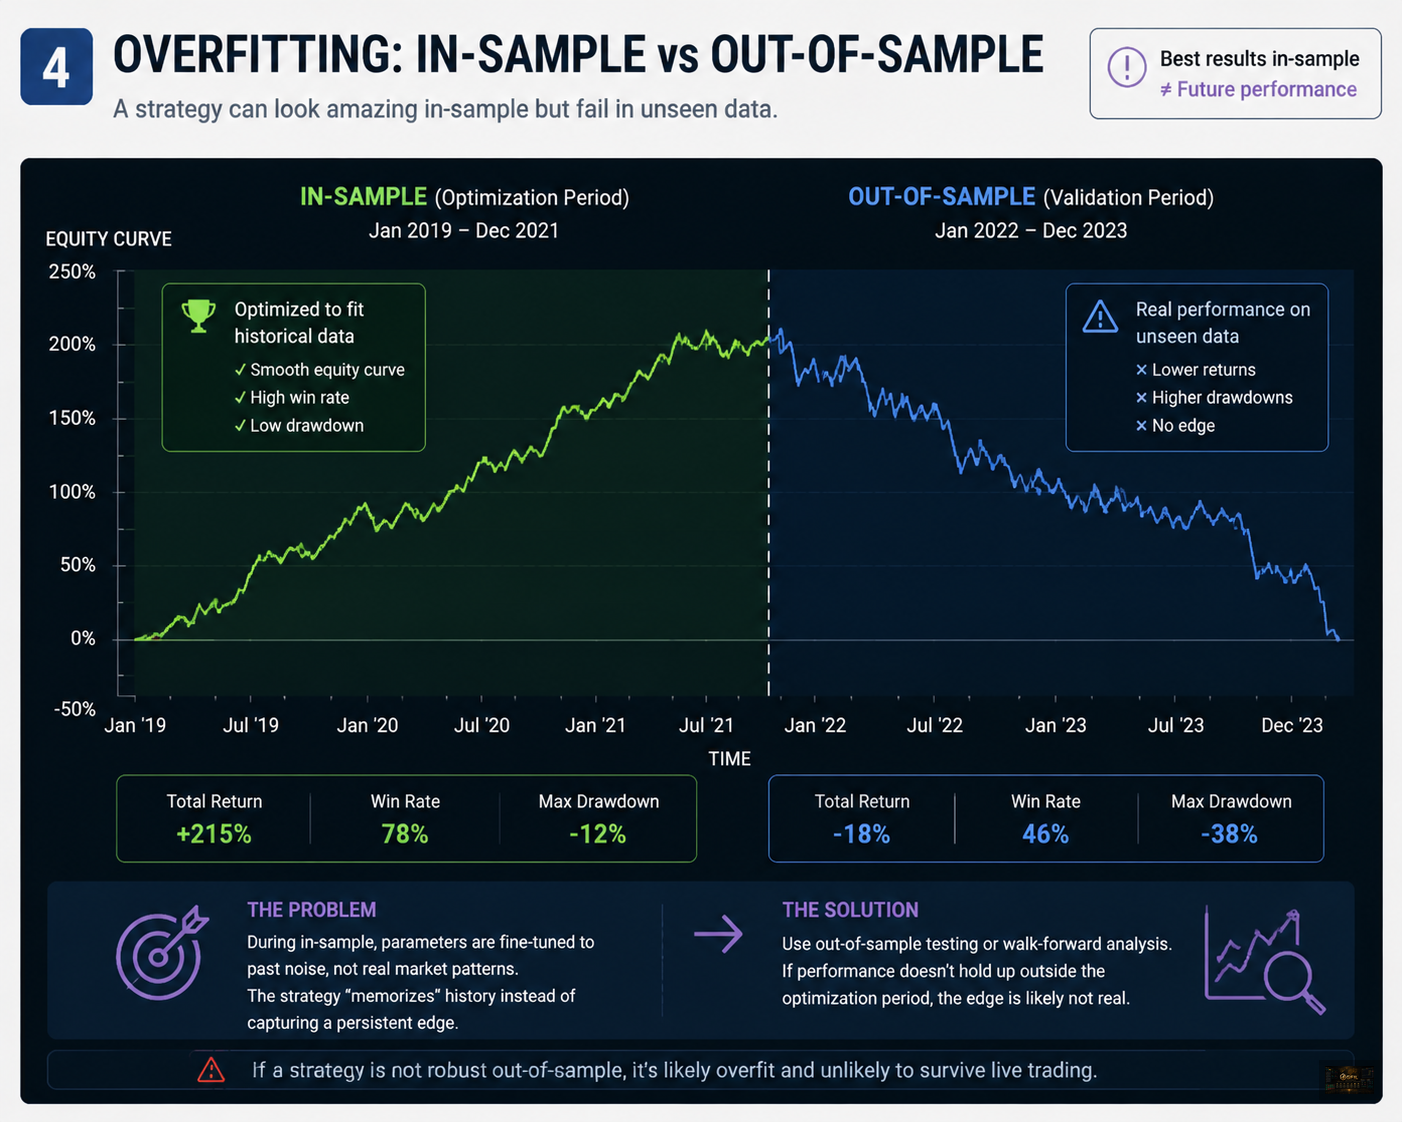
The honest version: optimize parameters on one segment of historical data (in-sample), then test the unchanged parameters on a later segment the optimizer never saw (out-of-sample), ideally repeated across multiple rolling windows (walk-forward analysis). If performance holds up out-of-sample, the edge is more likely to be real.
The dishonest version — usually not malicious, just methodologically careless — is optimizing directly against the full historical dataset until the equity curve looks good, with no reserved data to check against. This will always produce an excellent-looking backtest, because with enough free parameters (moving average lengths, RSI thresholds, ATR multipliers, session filters) any sufficiently flexible strategy can be tuned to fit noise in a fixed dataset. The number of parameters relative to the number of independent trades in the sample is a useful rule of thumb here: a strategy with 8 tunable inputs validated on 60 trades is almost certainly overfit, regardless of how clean the curve looks.
5. Win rate reported without path dependency or correlation
A strategy can have a genuinely real, reproducible 70% win rate and still be more likely to blow an account than a 40% win rate strategy with a healthy reward-to-risk ratio, because win rate alone says nothing about the sequence of outcomes or how the losses cluster.
Two things get skipped almost universally in vendor-published stats:
- Risk of ruin under realistic loss streaks. A 70% win rate strategy will still produce loss streaks of 5, 7, sometimes 10+ trades over a large enough sample — that's basic binomial variance, not bad luck. If position sizing was calibrated assuming losses are evenly spread out, a streak that's statistically unremarkable can still be financially fatal.
- Correlation across "diversified" signals. Running five signal feeds that each have an independently validated edge does not give you five independent bets if all five are long-biased dollar trades that all lose on the same macro surprise. Aggregate drawdown on correlated positions compounds in a way that per-signal backtests, evaluated in isolation, never reveal.
Both of these require Monte Carlo–style resampling of the trade sequence, not just a single historical run, and almost no retail-facing backtest report includes it.
A five-point checklist before trusting any published win rate
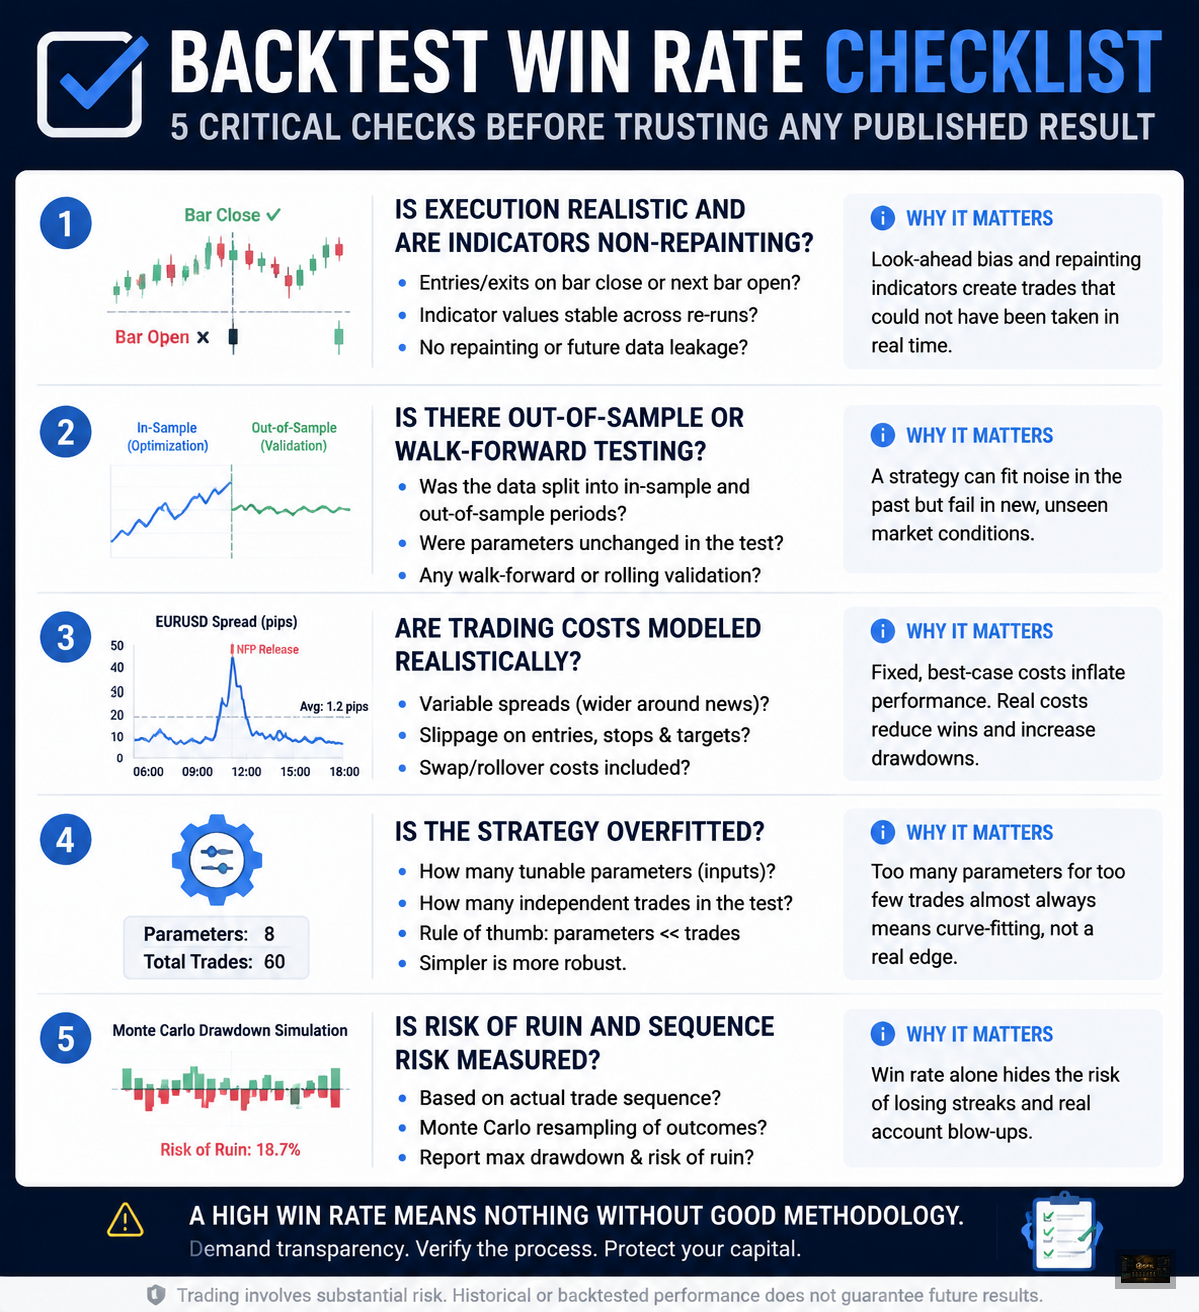
- Does the report specify bar-close execution, and is the indicator's historical output stable across re-runs (no repainting)?
- Is there an out-of-sample or walk-forward segment, or is the entire dataset one continuous optimization window?
- Is spread modeled as variable (with wider spreads around news windows), and are slippage and swap included?
- How many tunable parameters does the strategy have relative to the number of trades in the backtest?
- Is risk of ruin reported using the actual sequence of trades (or Monte Carlo resampling of it), rather than just win rate and average win/loss?
None of these require trusting the vendor's honesty — they're methodology checks anyone can ask for, and a strategy or signal provider that can't answer them isn't necessarily lying, but they haven't done the work needed to know whether their own number is real.
Trading involves substantial risk. Historical or backtested performance, however calculated, does not guarantee future results.
Frequently Asked Questions — Backtesting & Strategy Evaluation
What is backtesting in forex and gold trading?
Backtesting is the process of applying a trading strategy to historical market data to see how it would have performed. It answers the question: "If I had traded this exact rule set over the past X years, what would my equity curve, win rate, and drawdown look like?" A properly conducted backtest uses out-of-sample data (a period the strategy was not optimized on), variable spread modeling, and bar-close execution to avoid look-ahead bias. Without these safeguards, backtest results are statistically meaningless.
Why do most backtested trading strategies fail in live markets?
Five methodology flaws account for the vast majority of live-trading failures: (1) repainting indicators that show historically revised values rather than real-time signals, (2) survivorship bias where only the best-performing parameter variations are published, (3) static spread and slippage assumptions that ignore real market conditions during news events, (4) curve-fitting that optimizes parameters to noise rather than genuine edge, and (5) missing path dependency analysis that ignores how loss streaks compound risk. Each of these flaws can make a worthless strategy look statistically sound on paper.
What is look-ahead bias in trading strategy backtesting?
Look-ahead bias occurs when a backtest accidentally uses information that was not yet available at the time of each simulated trade. The most common form is same-candle execution — triggering an entry on the current unclosed candle rather than waiting for it to close. This lets the backtest "see" where the candle finishes before deciding whether to enter. Another form is using repainting indicators whose historical values change as new bars form. Both inflate apparent edge and produce win rates that are impossible to replicate in real-time trading.
What is repainting in trading indicators and why does it matter for backtesting?
Repainting is when an indicator recalculates and changes its historical values as new price bars close. A common example is a ZigZag indicator that redraws past swing points, or an adaptive moving average that shifts its historical curve. When you run a backtest today, you see the final, repainted version of every historical bar — a version that never existed in real time. The strategy appears to have caught every swing perfectly because, retroactively, it did. This is the single most common source of inflated backtest performance in retail trading tools.
What is survivorship bias in trading strategy selection?
Survivorship bias in strategy selection means a vendor tests 40 parameter variations of the same basic idea, publishes only the best 2 or 3, and never mentions the other 37 that failed. Every number in the published report is technically true, but the selection process makes them meaningless because you are only seeing the survivors of an undisclosed optimization contest. The absence of an out-of-sample test period, walk-forward validation, or any discussion of discarded variations is the tell.
How does spread and slippage affect backtest accuracy for forex and gold?
Most retail backtesting platforms default to a fixed spread (e.g., 1.2 pips on EURUSD) applied uniformly across the entire test period. In live trading, spreads are variable — they widen during the London/New York overlap, spike sharply around NFP and CPI releases, and on XAUUSD can move from single digits to 40+ points in seconds. Slippage on stop-loss and take-profit orders during fast markets, plus overnight swap costs, compound the discrepancy. A strategy tested with static spread assumptions will always look better on paper than it performs in live conditions, especially if it trades around news events.
What is curve-fitting in trading strategy optimization?
Curve-fitting, also called over-optimization, is tuning a strategy's parameters to fit the specific noise pattern of a fixed historical dataset rather than capturing a genuine, repeatable market edge. With enough free parameters — moving average lengths, RSI thresholds, ATR multipliers, session filters — any strategy can be made to look profitable on past data. The honest alternative is walk-forward analysis: optimize on one period (in-sample), test on a later, unseen period (out-of-sample), and repeat across multiple rolling windows. A rule of thumb: a strategy with 8 tunable inputs validated on only 60 trades is almost certainly overfit, regardless of how clean the equity curve appears.
How can retail traders evaluate a published trading strategy's backtest quality?
Five questions cut through the marketing: (1) Was the backtest run with bar-close execution and non-repainting indicators? (2) Is there a genuinely out-of-sample period, not just a continuous optimization window? (3) Are spreads modeled as variable with wider levels around news events, and are slippage and swap costs included? (4) How many tunable parameters does the strategy have relative to its number of independent trades? (5) Is risk of ruin calculated from the actual sequence of trades, using Monte Carlo resampling, rather than just win rate and average win/loss? A vendor who cannot answer all five has not done the work needed to know whether their own numbers are real.

Leave a Comment